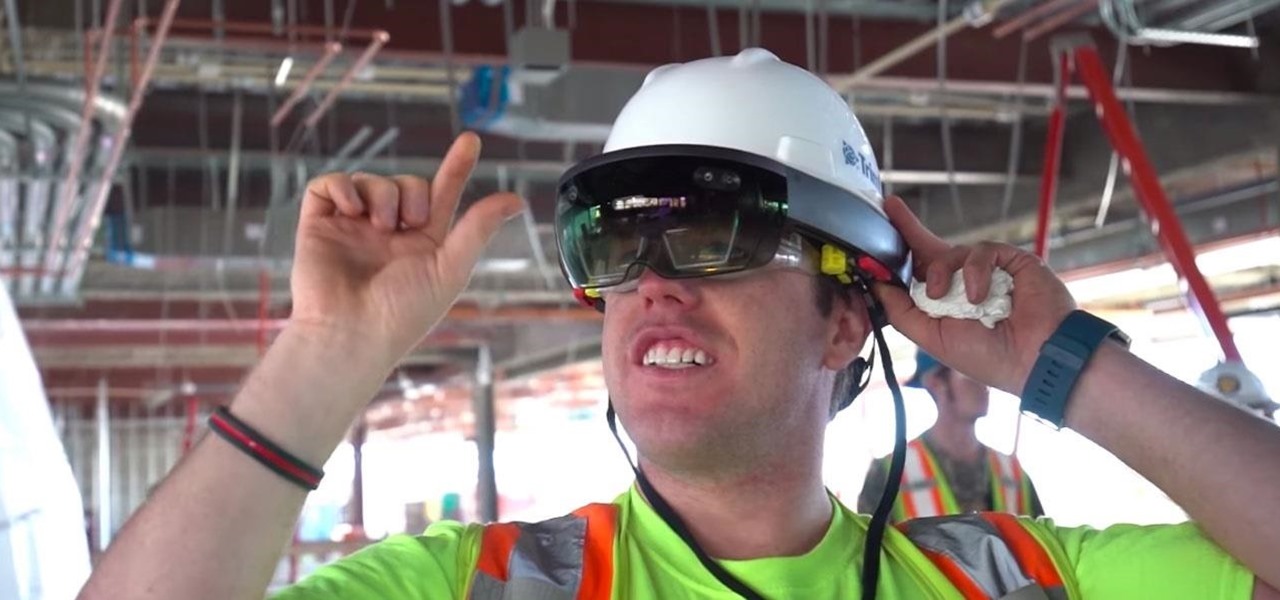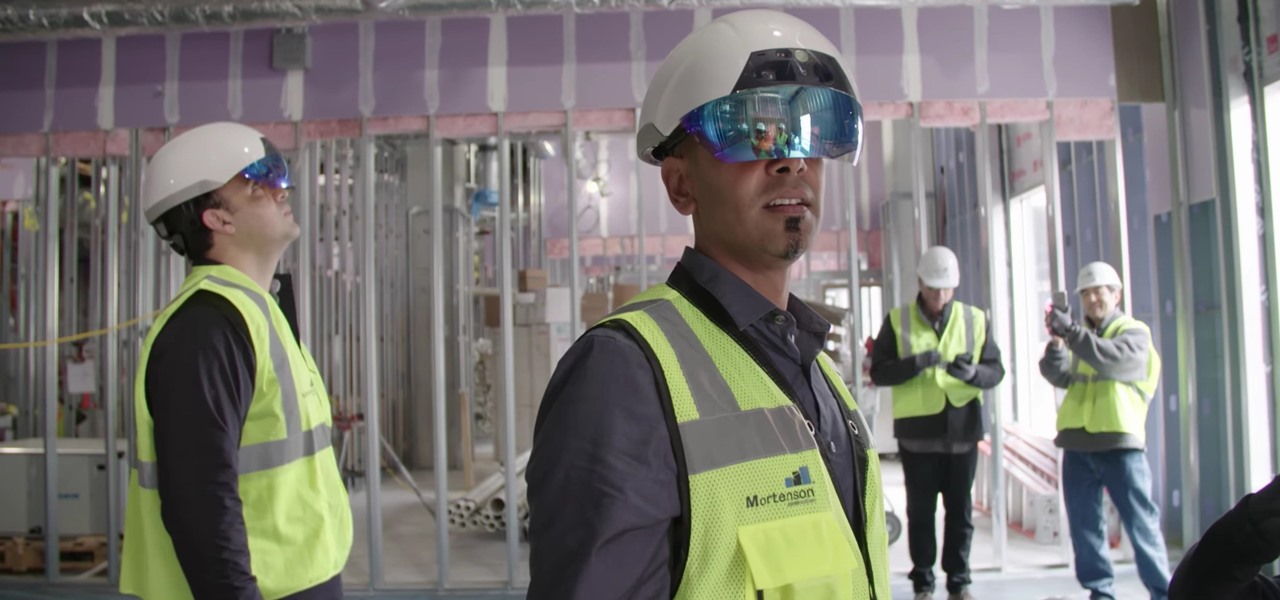
Trimble is integrating its mixed reality applications into the DAQRI Smart Helmet to enable outdoor and on-site support for design, construction, and heavy industry as part of a collaboration the companies announced today.
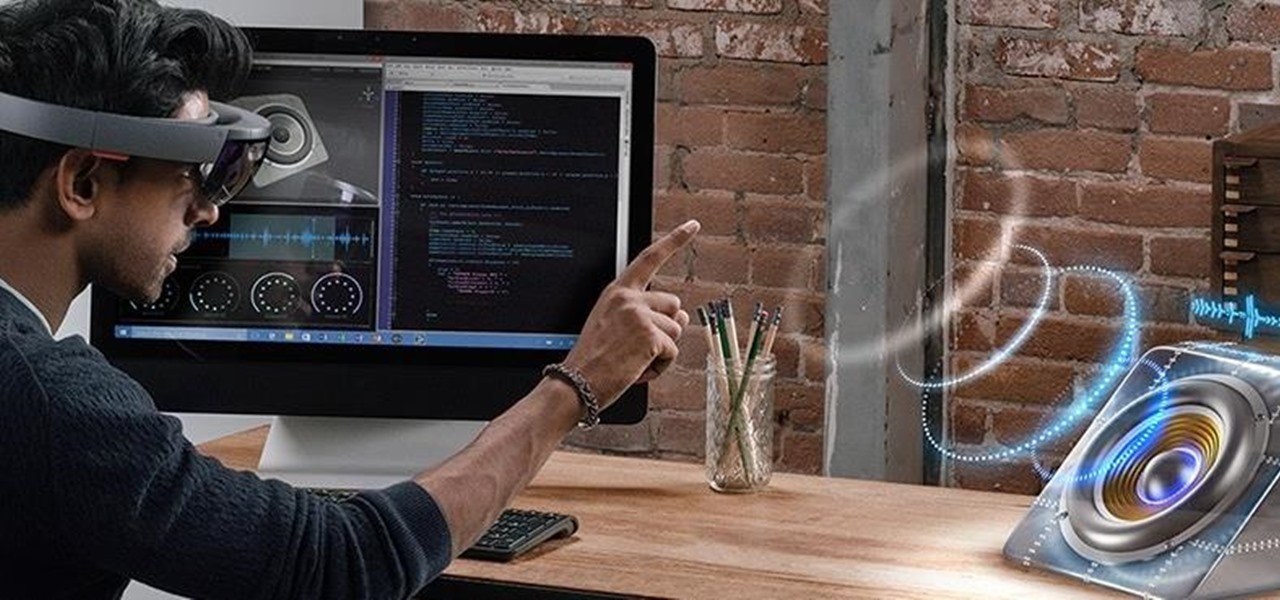
When developing for the HoloLens, keeping a constant 60 fps (frames per second) while making things look beautiful is a challenge. Balancing the processing power to display complex models and keeping the frame rate where it needs is just a straight up painful process, but a solution seems to be on the horizon.
Everyone seems to be talking about Elon Musk's new futuristic Tesla Cybertruck, the vehicle that either looks like a cool moon rover or an outlandish video game replica, depending on your tastes.
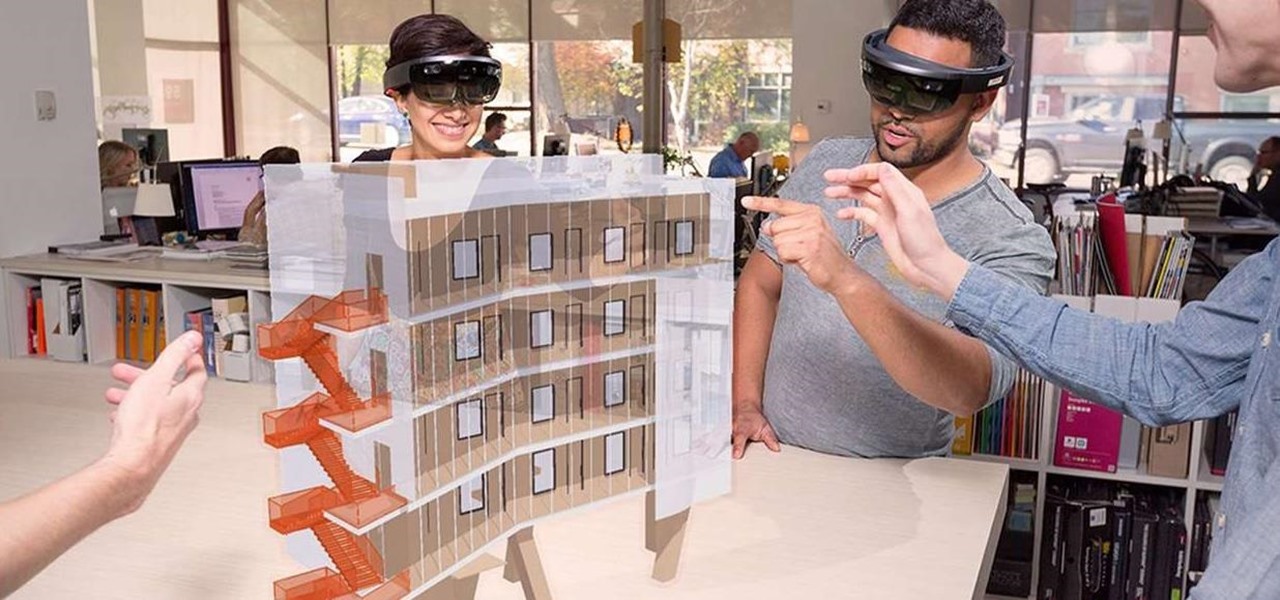
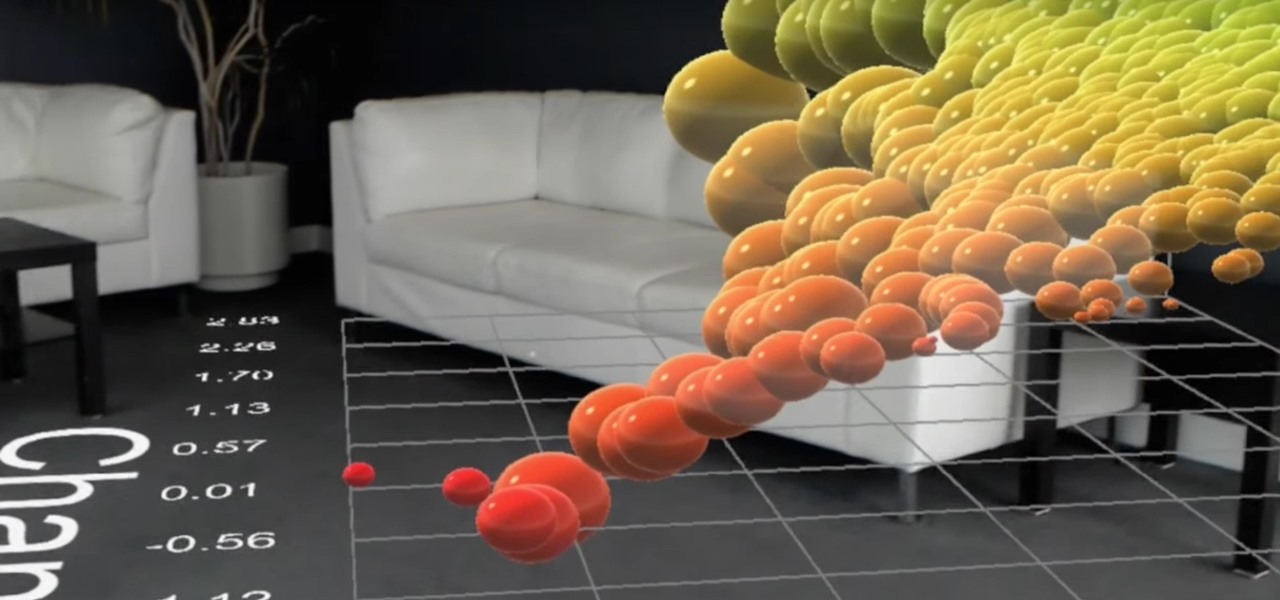
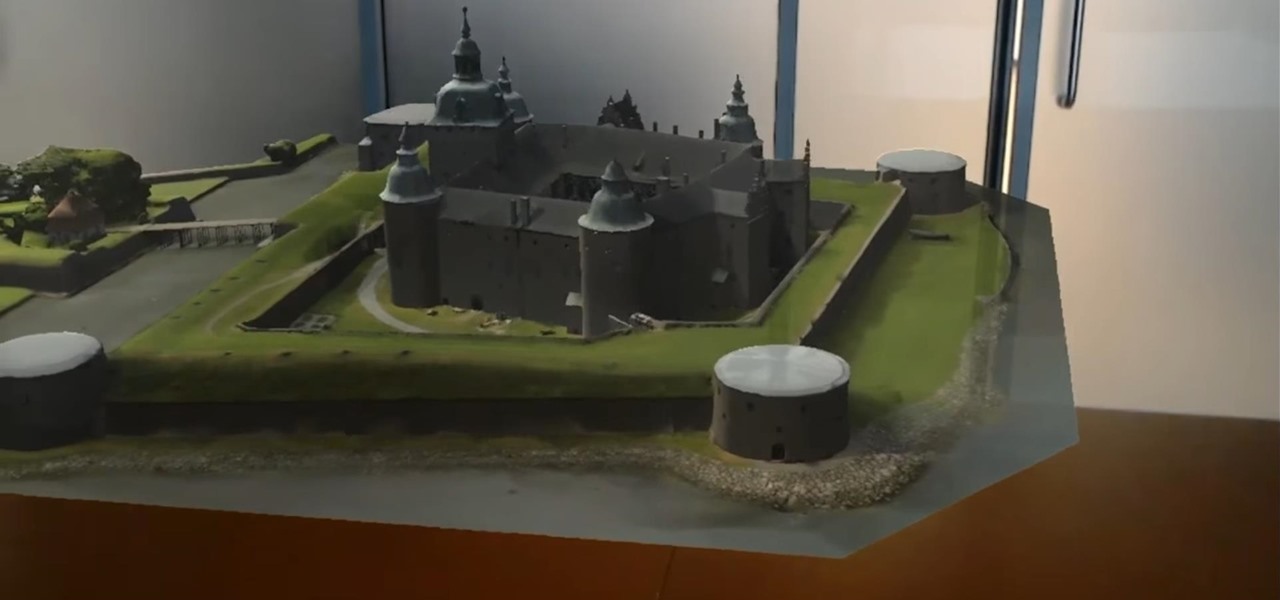
Visualization is one of the obvious commercial applications for technology such as Microsoft's HoloLens. The ability to see the assets of a project in different scales—from micro to larger-than-life—with a quick air tap will play a large part in the coming augmented reality revolution. Whether the assets are art for a game, interior design, raw financial data, or architecture, data visualization will play an important role in the future. This is due, in part, to our ability to absorb informat...
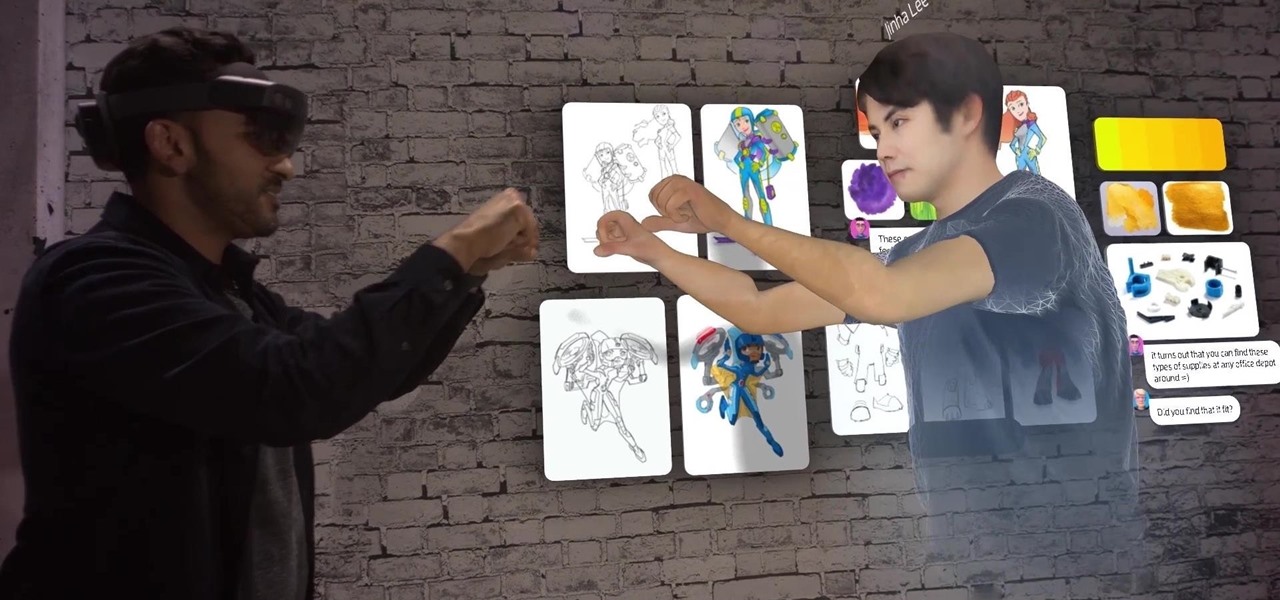
For enterprise augmented reality platform makers, remote assistance apps represent one of the greatest opportunities to show off the power of immersive computing. These apps enable experts to guide front-line workers or customers with AR prompts and other content in the field of view of their smartphones or smartglasses.
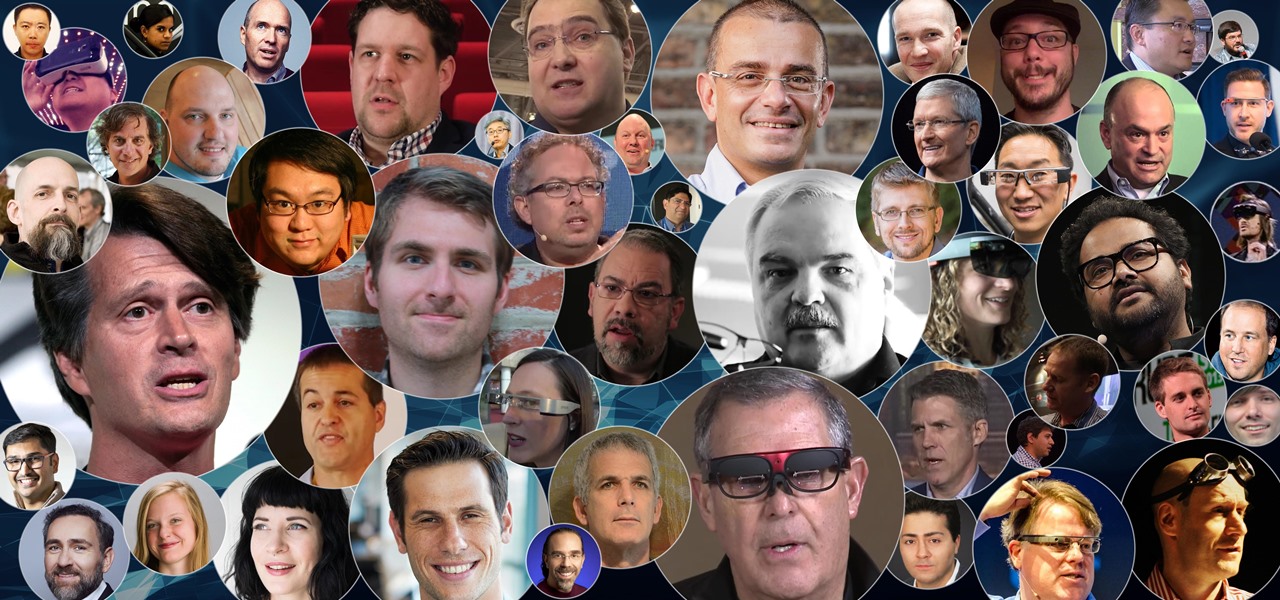
A new technological movement without the technology itself is just an idea sitting and waiting. Once the technology is present in the equation, movement forward can begin. This is how many of us see the head-mounted displays (HMDs) and smartglasses that have recently entered the augmented and mixed reality market — or are coming out in the next few months. This is a movement that will sweep over the world, changing everything in its path, and these are some of the people behind it.

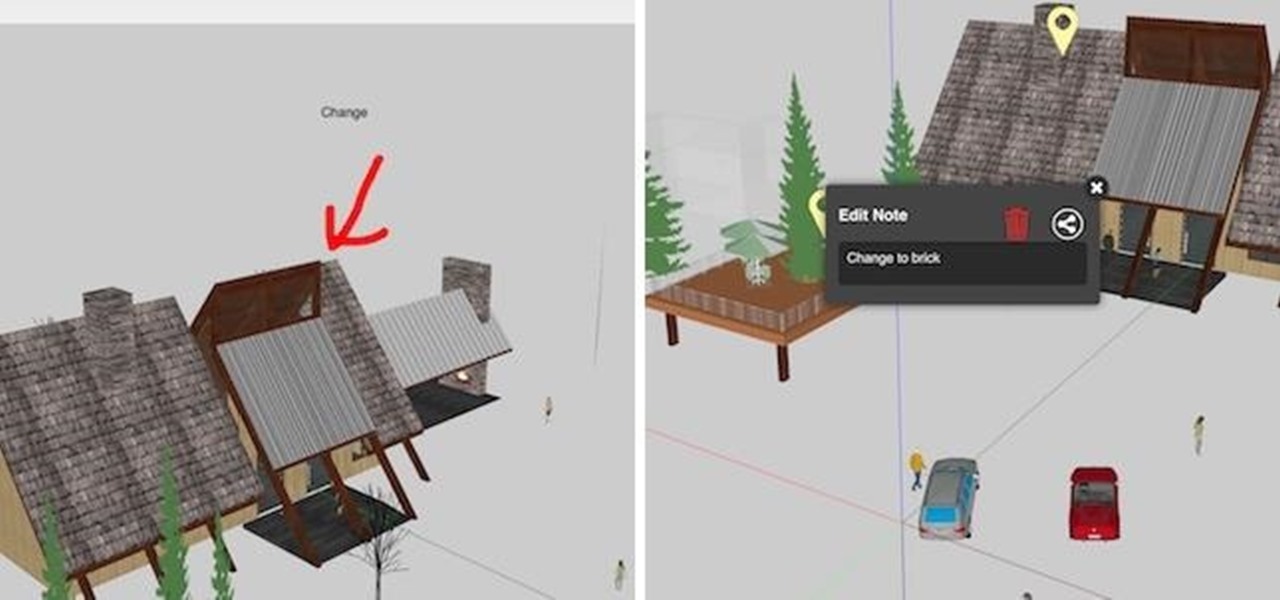
In the past, to see a pre-constructed state of the house that you would one day live in, you had to be able to read blueprints or hire an artist to sketch it out. Later came the ability to have a 3D rendering of that house on a screen, but you'd still have to work hard to envision it in real life.
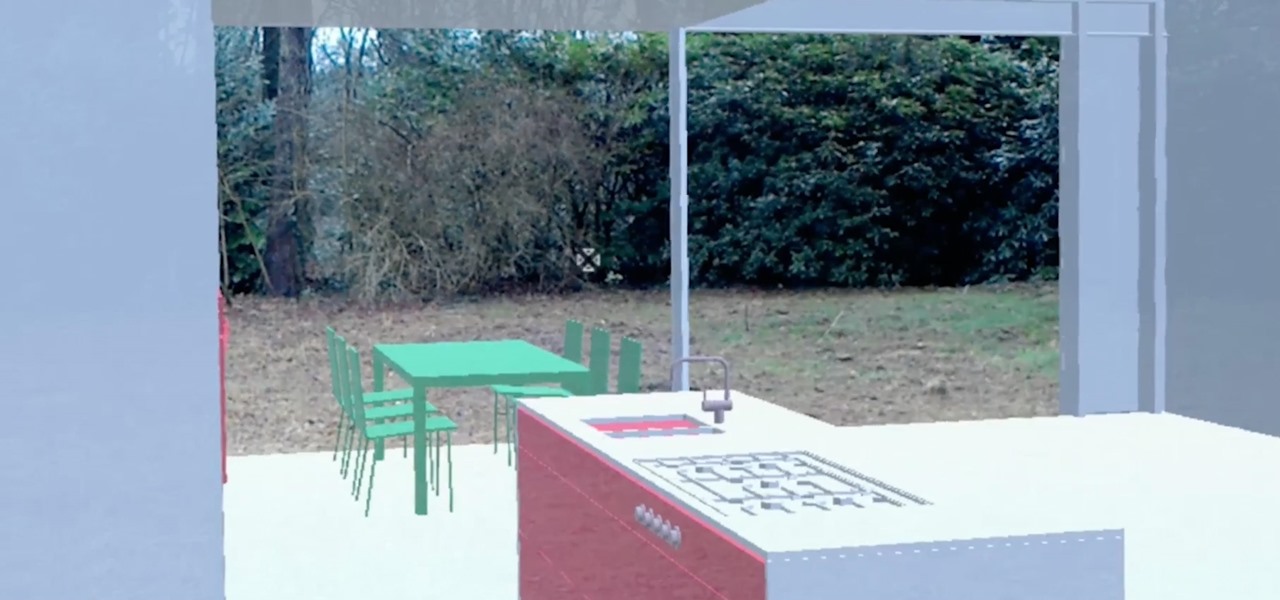
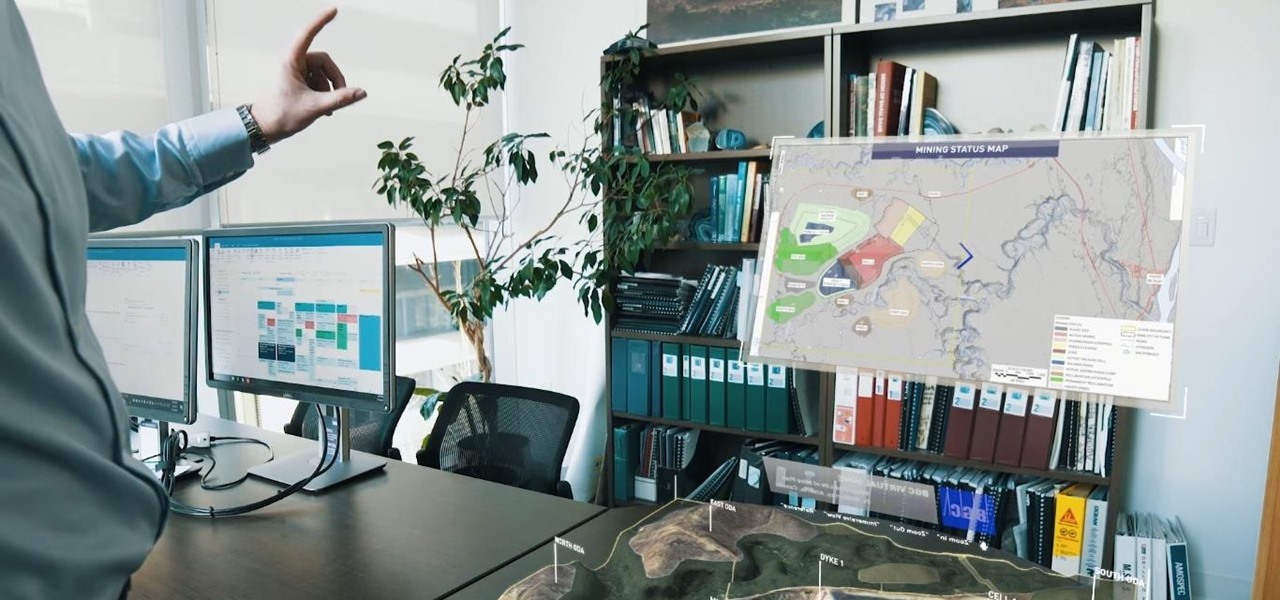
LOOOK, a Seattle-based mixed reality and development studio, can now peer into the future with their new geotechnical engineering visualization application for Microsoft HoloLens.
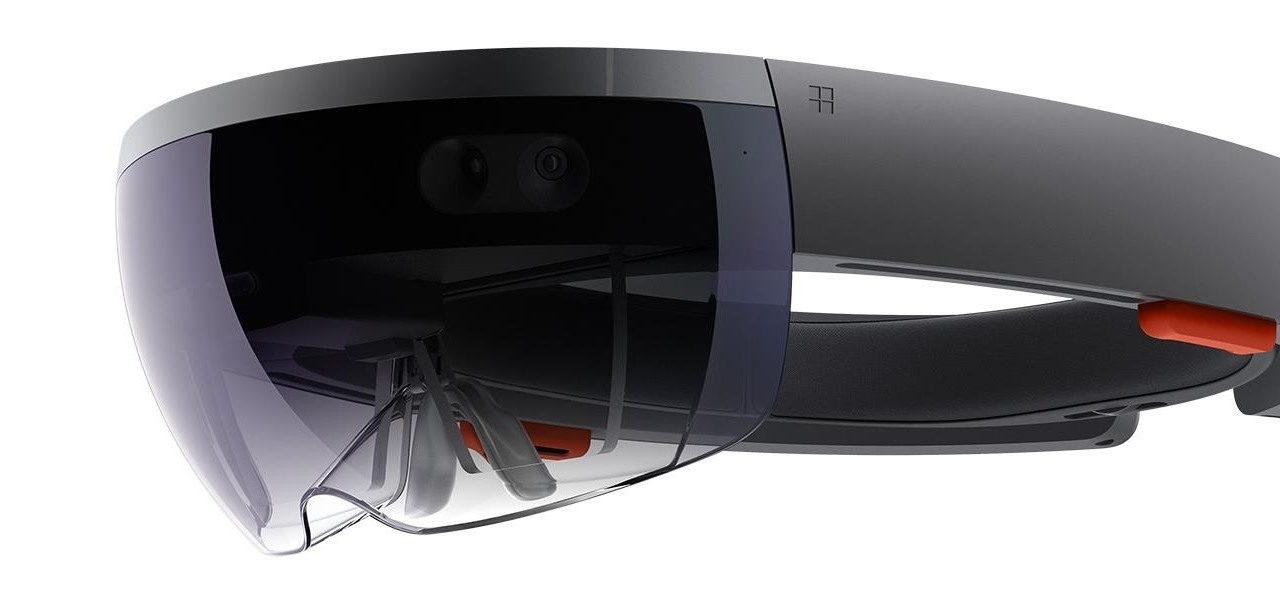
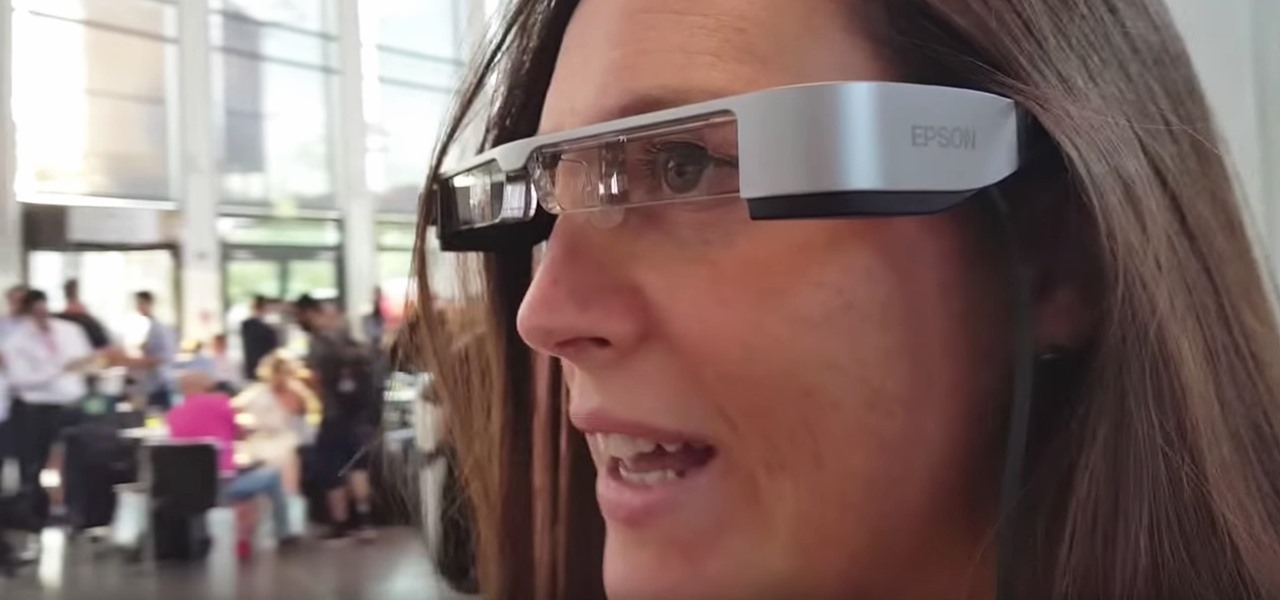
While the consensus among some in the augmented reality community is that the Microsoft HoloLens is the best device available at present, it also remains the most cost-prohibitive option, with the development edition costing $3,000.
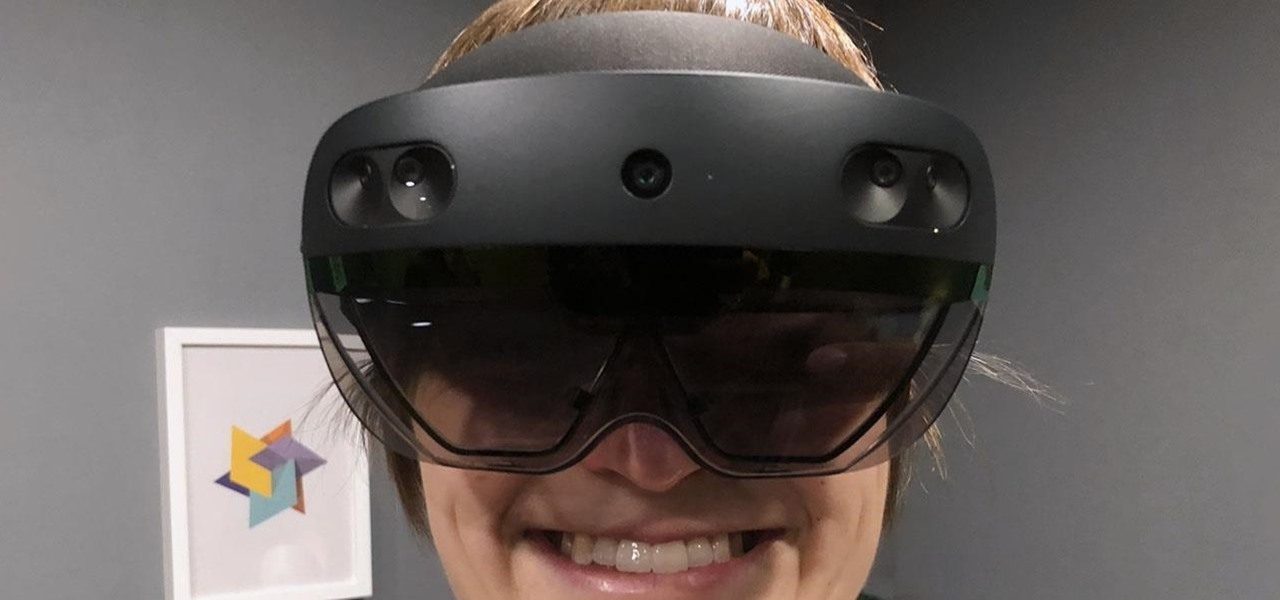
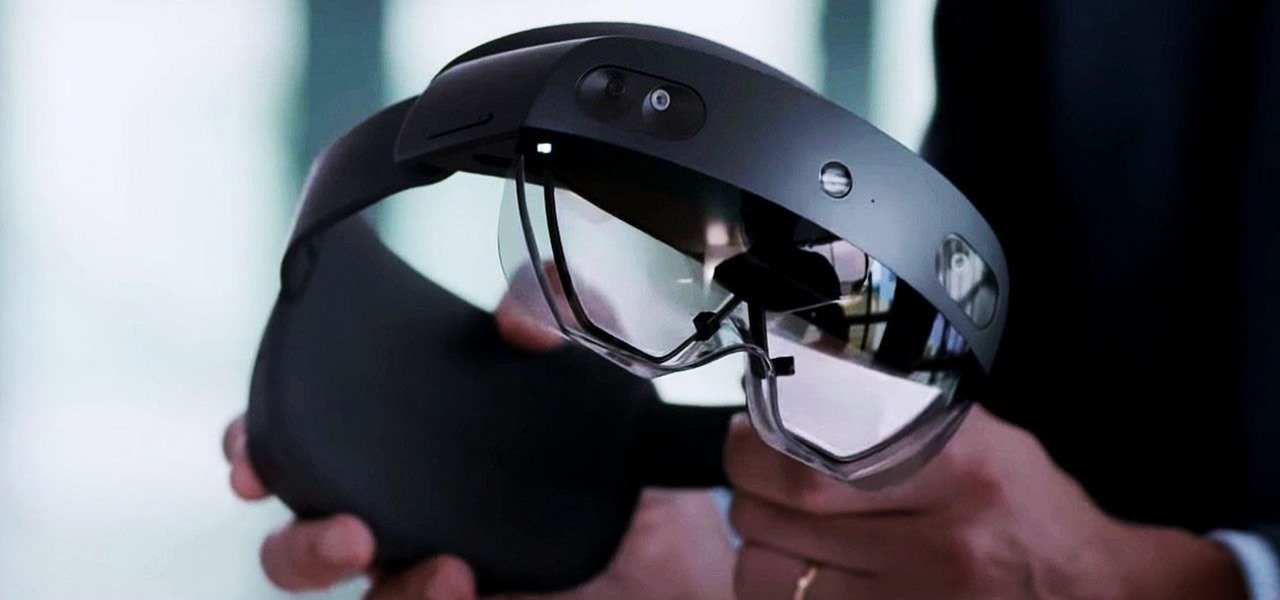
After years of waiting, Microsoft has finally updated its industry-leading augmented reality device, the HoloLens.
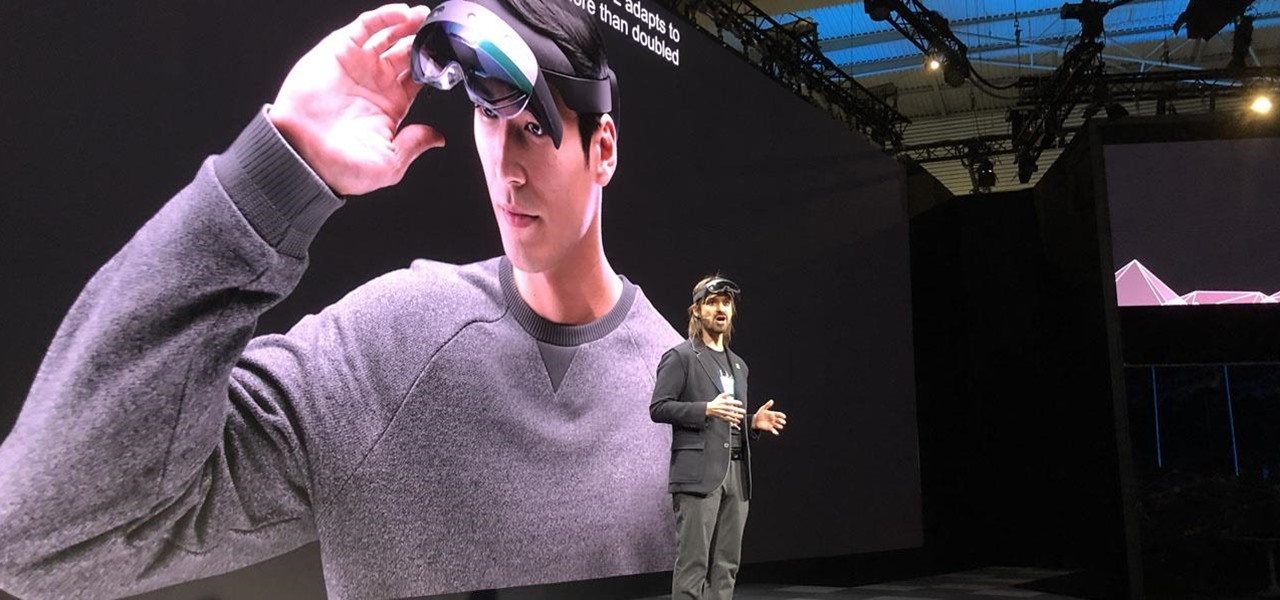
In the last couple of days there's been a lot of speculation about the powers of Microsoft's HoloLens 2, but few have had a chance to get their hands on one to see if the company's claims live up to what HoloLens inventor Alex Kipman showed off on stage.
Throughout this NR50 series, we have talked about the incredible growth the augmented and mixed reality space has seen in the last year. More devices, software, developers, and use-cases seem to arrive daily. For this growth to have occurred, it took the work of many people, from many different backgrounds and skill sets — and Next Reality wants to recognize them for all that they have done and are doing.
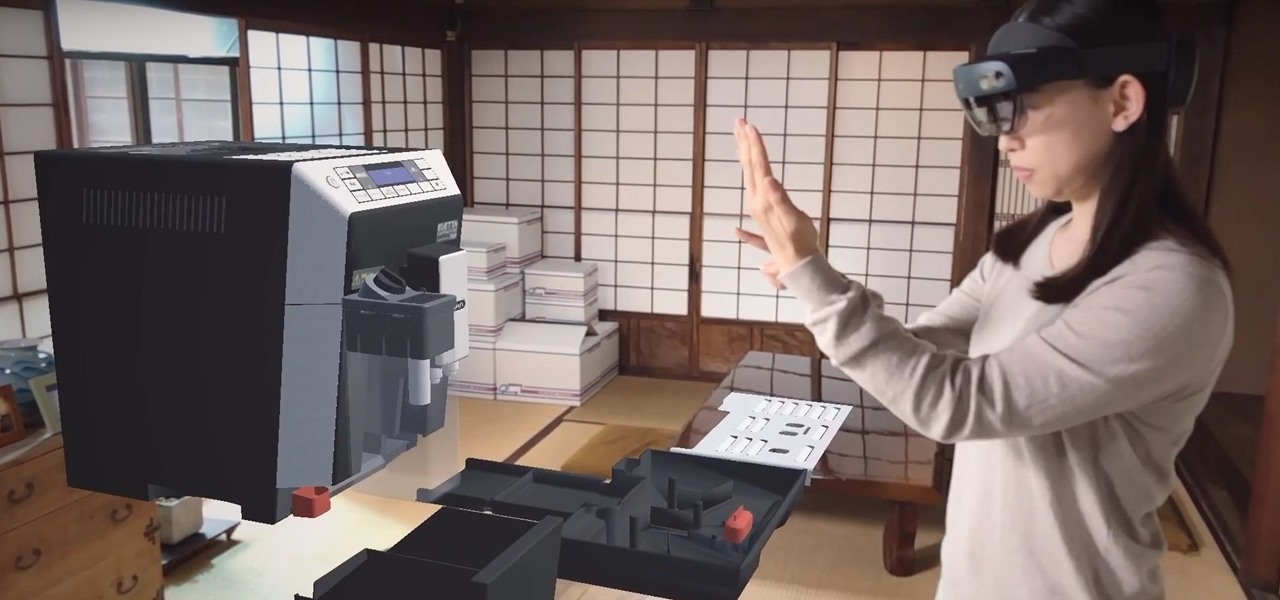
Less than a month after the worldwide launch of HoloLens 2, call center consultant BellSystem24 has already prepared an augmented reality solution for one of its clients.
While the tech industry is hot in pursuit of mainstream smartglasses for consumers, another early maker of enterprise-focused AR hardware has apparently met its end.
The mystery surrounding the release of the next version of the HoloLens has been swirling for months, but at least some of that mystery may removed in the coming weeks.
With products and solutions offered by the likes of Scope AR, Trimble, DAQRI, VIATechnik, and others, augmented reality is becoming a hot commodity for improving productivity while maintaining safety in the construction and manufacturing industries.
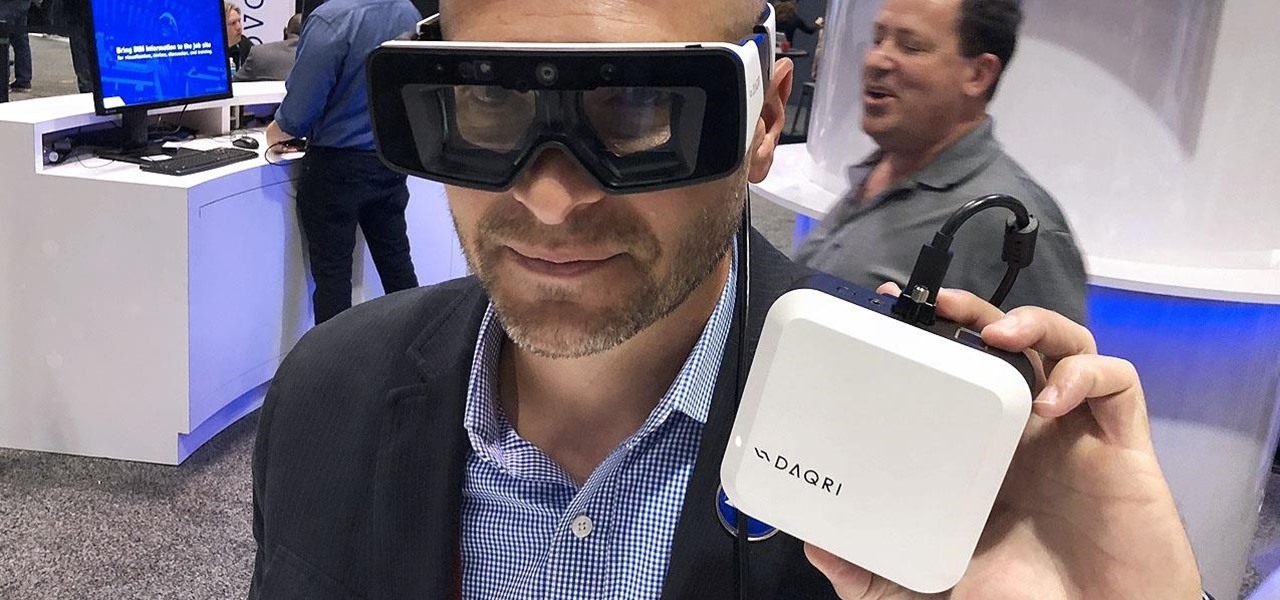
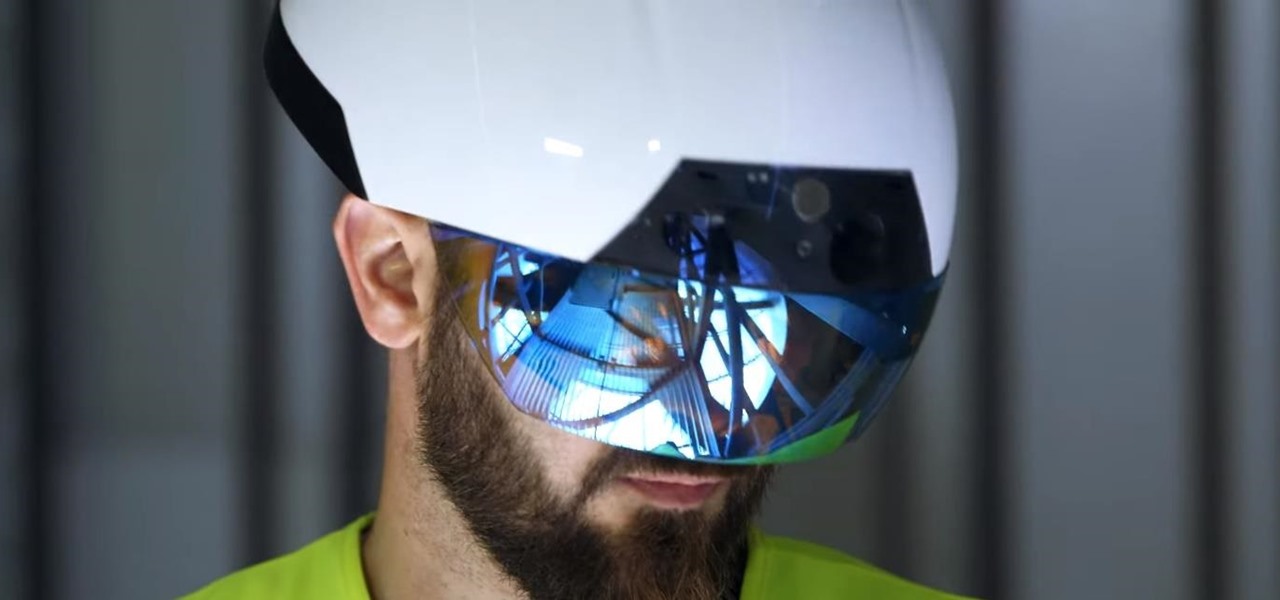
While the mainstream consumer market waits for cool augmented glasses to arrive from Magic Leap, or maybe even Snap Inc. (Spectacles 2.0??), AR headset maker DAQRI and its business customers are finding new, money-saving and time-saving use cases for the technology today.
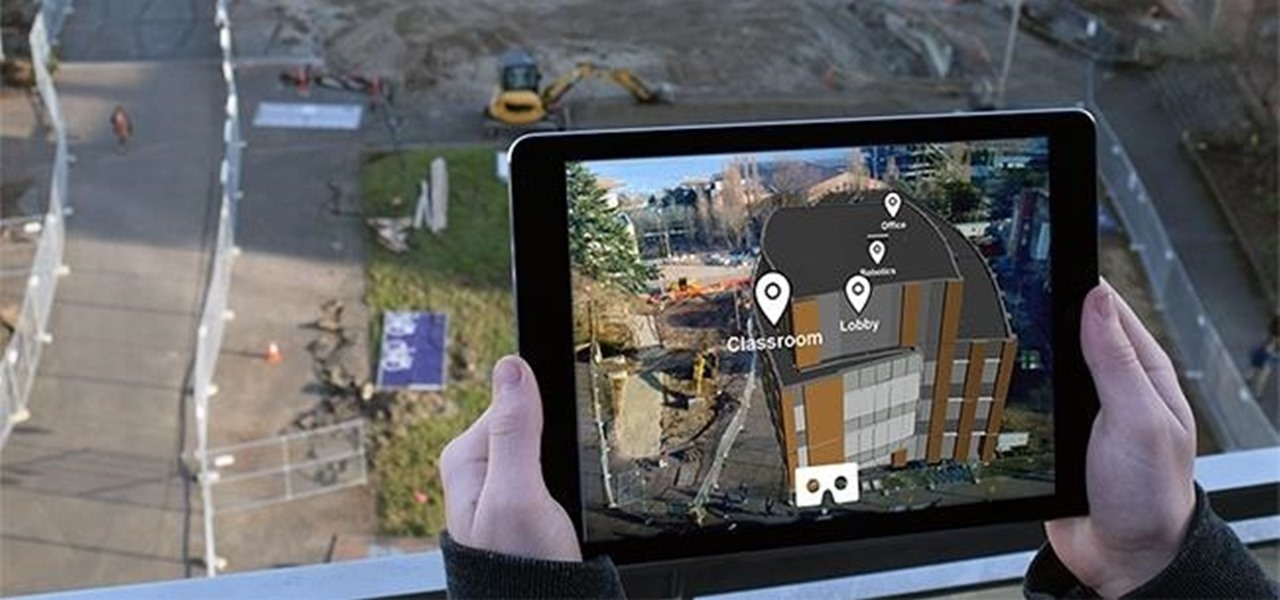
It's fitting that students at the University of Washington can catch a glimpse of the new, 135,000 square-foot computer science building in augmented reality before construction is completed.
Augmented reality upstart DAQRI announced today that it has strengthened their in-house talent by recruiting renowned physicist Seamus Blackley and acquiring a team of 15 engineers and scientists from Heat Engine, LLC.
HoloLens developer Michael Peters of In-Vizible has released quite a few videos since receiving his HoloLens last year. Many of his experiments are odd and funny, but some include serious potential approaches to data visualization. In the videos embedded below, you'll specifically see stock market information beautifully rendered in different ways to help understand the data.
To revise a line from the Blues Brothers, when it comes to ARKit apps, we've got both kinds — home utilities and games. As such, two more candidates for each category have made their way to the app store.
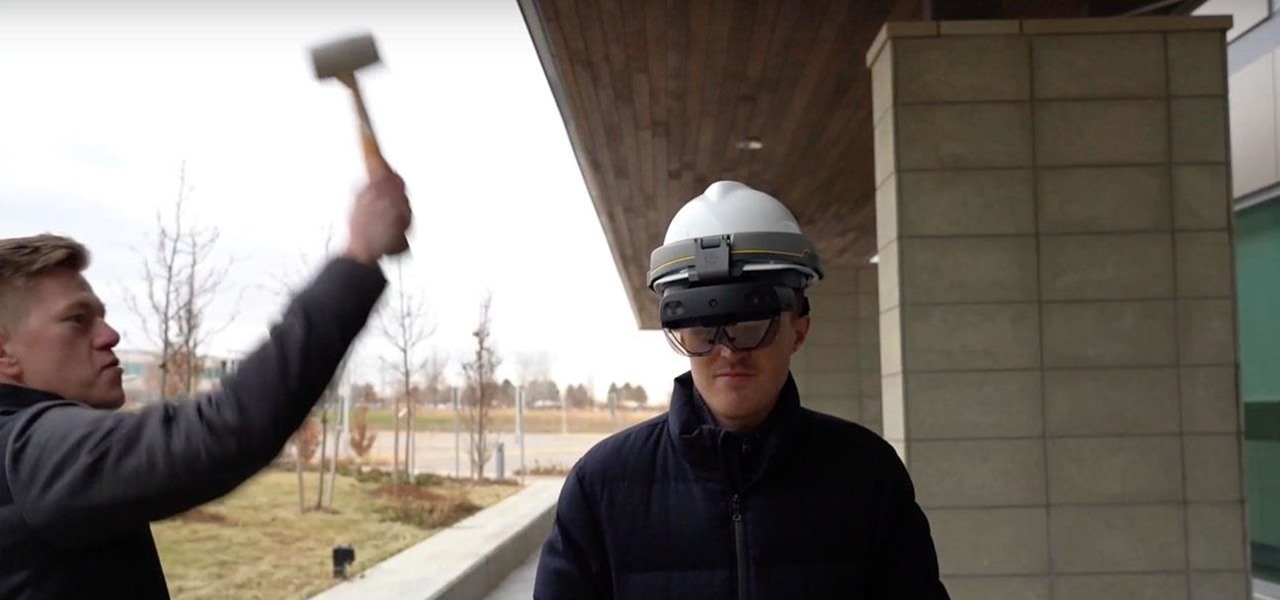
Last week, Next Reality wrote about how the Microsoft HoloLens team is partnering with thyssenkrupp. Their mission? To bring mixed reality to the workplace. Now, Microsoft has just confirmed in a blog post that the HoloLens has passed the basic impact tests for protective eyewear in North America and Europe.
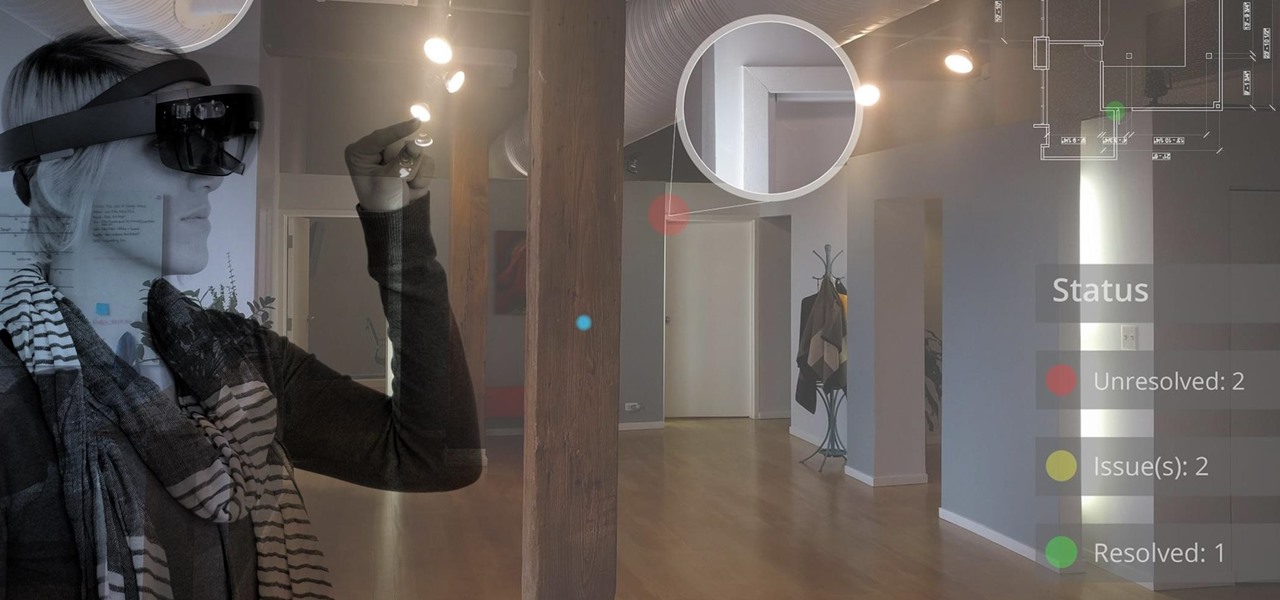
A virtual design and construction services firm has built an augmented reality application that uses the Microsoft HoloLens to improve the efficiency of quality control on construction sites.
The long wait is over — the best augmented reality device on the planet is finally available.